This week, I worked on the software side of the Lightning Globe. The goal is to find out if the project is feasible and how would I go approaching it.
First, I tracked down the source of the lightning data. Since Lightning Map, does not offer any Application Programming Interface (API), that I could connect to, I had to find a different source. I stumbled upon the WWLLN (World Wide Lightning Location Network), which Lightning Map used data from.
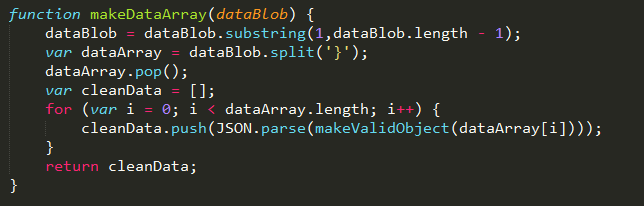
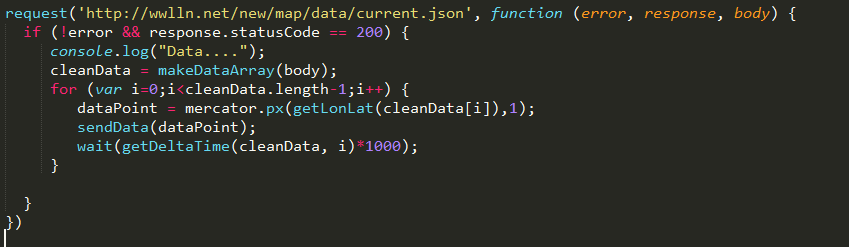
After a bit more digging I came upon the JSON data that the website is using: http://wwlln.net/new/map/data/current.json. The data is a collection of the most recent 5000 lightning strikes, along with latitudes, longitudes, and timestamp. A quick calculation shows that on average this file alone could provide 13 minutes of lightning data!

I chose NodeJS to process the data – mostly because I am familiar with it, and Javascript offers an easy way to talk to LED strips via Johnny-Five, and my own previously written code. I will need to turn this big block of text into events that can be sent off to the LED strip.
I quickly ran into my first problem, since JSON data is unordered, which means that the moment I import the data in Javascript, it will reorder itself and the lightning timeframe will be out of sorts. To remedy this I had to do some data finagling by splicing each entry, then importing them as an array.
Next up is to convert Longitudes and Latitudes on to a 2D surface. Since the data used Google Maps API, they would have to follow something called Spherical Mercator Projection. This involves some complex calculations – thankfully our good friend @mapbox wrote a Javascript library for it.

With everything put together, the code outputs a 17×17 matrix, with “-” for no lightnings, and “X” for lightning strikes.
Next I will try to translate software data into flashing lights!