For this project I aim to create an interactive piece that connects people with events that’s happening all around us, and I also want to play around with real time data. After lots of research, and heavily inspired by an older project of mine, Twitch Plays Drums ( https://github.com/nhtranngoc/twitch-plays-drums ), the Lightning Globe was born.
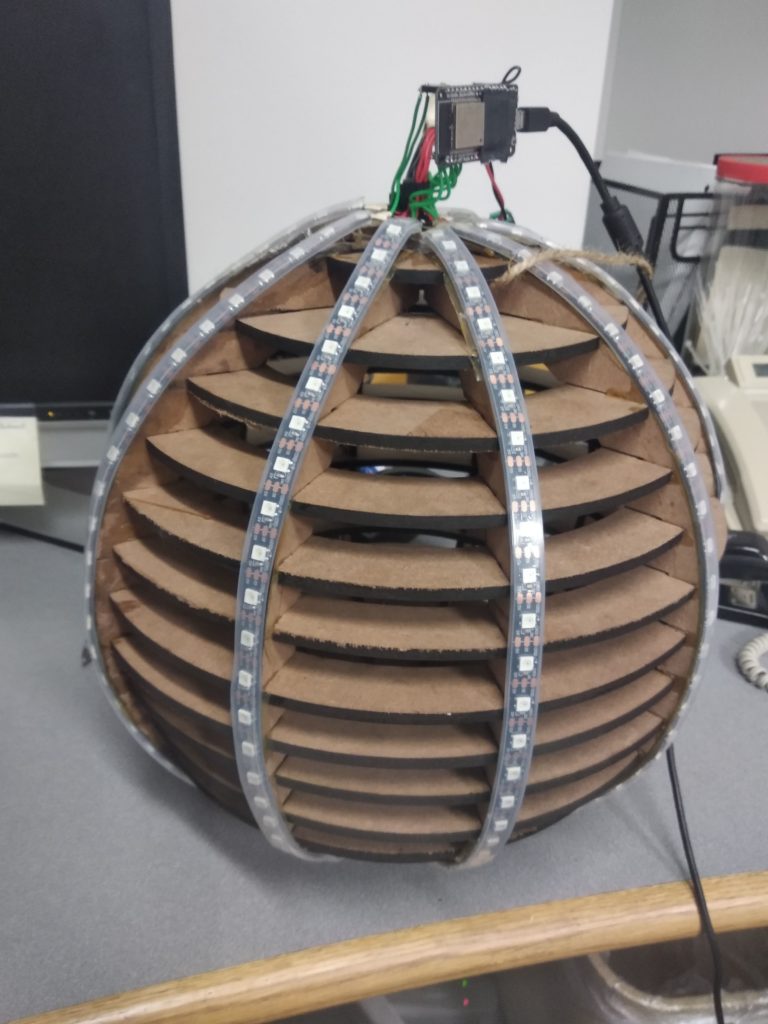
The Lightning Globe is a 13” diameter globe with LED strips on the side that, when connected, will simulate lightning strikes all around the world. Each LED pixel is mapped to a range of longitudes and latitude, and the sculpture fetches data from the World Wide Lightning Location Network (http://wwlln.net/), a project by the University of Washington that incorporates lightning detectors all around the globe. Each detectors can cover around an area of around 1000km radius, and each lightning strikes is reported and added to the database.
The development of this project consist of both hardware and software. The globe is a hollow sphere modeled in Fusion360, then imported to Slicer for Fusion360, an add-on program that processes 3D models for laser cutting and papercraft. The model is then cut into an approximation using radial slices, and exported as .DXF drawings. These are then cleaned up using Illustrator and Inkscape, before being sent to the laser cutter.

The whole globe is cut on 1/4” MDF sheets, using two 2′ by 4′ sheets bought from Home Depot. Careful cutting was required in order to not break the vertical spines, and is generally better using a low power, multiple pass setting. The laser cut parts are then washed off of charring, given a light coat of mineral oil for protection before being glued together.
The LED strip used was an Alitove WS2812b strip, the same LEDs are more commonly known as NeoPixels. The strip is 5m long (16.4ft), with 60 LEDs/meter or 300 LEDs total. Since we don’t want to waste the whole strip (WS2812b are expensive!), we would like to divide the strip into even pieces, which brings us to the design decision of the globe size.
At 13” in diameter, the radius is 6.5” or 16.5cm. This gives us a cross-sectional perimeter of ~102cm calculated by 2*pi*r. This, in turn, gives us the measurement for a vertical line on the globe at 51cm. This means that if we cut the strip to 10 equal, smaller strips we get 30 LEDs each. Hooray for math! This explains the respectable size of the globe, which is a conscious design decision and definitely not something occurred through sheer dumb luck.
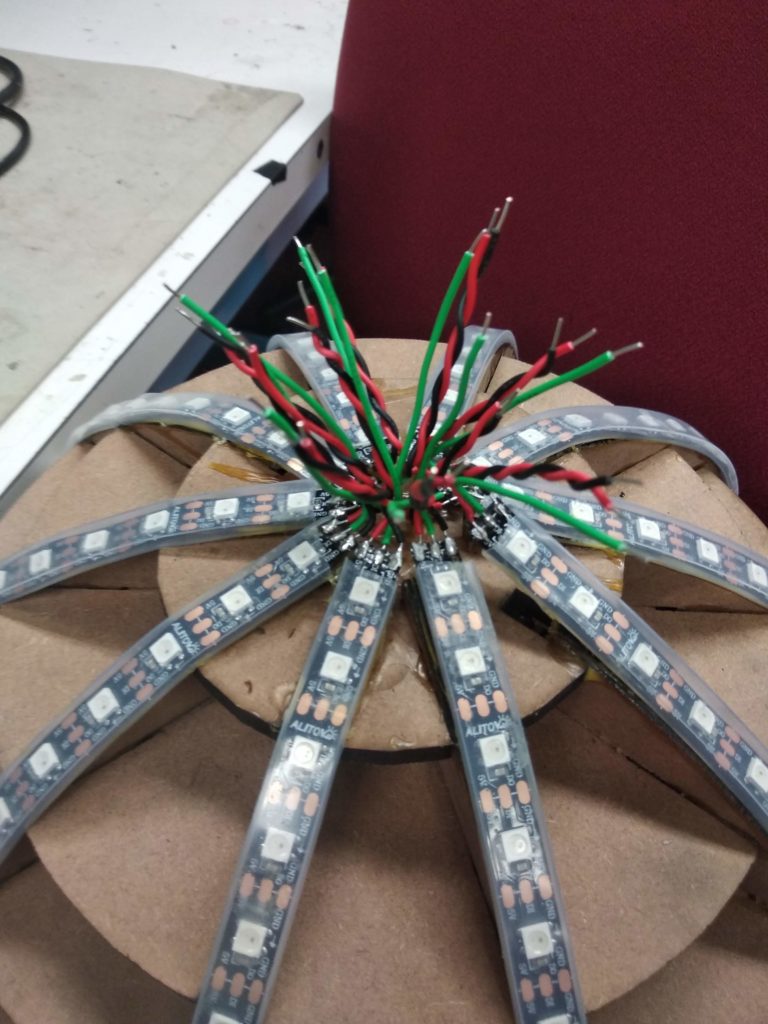
The smaller strips are glued on to the spines of the globe using epoxy. Then wires are soldered on and connect them to the ESP32 chip, and a separated line for power. Given the maximum usage of ~5 LEDs at any given time since we are only displaying lightning, a power supply was unnecessary – however, in the event we want to light up all LEDs, and with each LEDs consuming a maximum current of 60mA each, we would need a 18A power supply. In normal operations an external power brick isn’t needed and the ESP32 can supply enough current for a few LEDs.

The software side of things is also twofold. We have the “server-side” code on Javascript and the “client-side” Arduino code on the ESP32 chip. The reason they are called server/client is because the ESP32 is nothing more than a serial interface used to control LEDs. By sending specific packets via serial port to the ESP32 chip, we can control the LEDs. This is based on a protocol I developed for my previous nopixel project and is relatively lightweight and can handle up to 100 FPS for 300 individual LEDs. This is also portable, meaning it can work with other communication protocols such as MQTT, websockets and Bluetooth.
The server side is a bit more hefty. It starts out by requesting lightning data from WWLLN server (http://wwlln.net/new/map/data/current.json). This returns a JSON file given as plain text, containing the last 5000 lightning strikes. At an average Strikes Per Minute of 400, this one singular data file should last for 13 minutes, well over the length of the presentation.
After being cleaned up and properly formatted, the data is forced to do some maths, which maps the longitudes and latitudes to different points on the globe. The bulk of this is done using a simple map function that maps the value from a given range to another range of numbers. The function also accounts for warped coordinates caused by the lower resolution of the globe.
Next up, the code sends off the new coordinate information into a renderer, which assigns each lightning strikes a random variable length – this helps making each strikes feels more natural, and generate a fade out animation. Then the whole data frame is compiled and sent to the ESP32 chip at a rate of 60 FPS, good enough for smooth animation while not overwhelming the data pipe.
At the same time, the code waits an appropriate amount of time, based on the delays between lightning strikes, and then moves on to the next one. The whole cycle then restarts.
That is an overview of the Lightning Globe. While not extremely complicated, the project hit a few roadblocks on the way but I am glad that I managed to get through all of them. However, given the quiet rushed timeframe, I wish I would have more time to work on it.
I would like to thank Prof. Rosenstock and the HU3910 class for giving me constant feedback and suggestions on the project, and my wonderful girlfriend who insists on driving me to Home Depot instead of letting me walk around carrying two 2×4” pieces of plywood all the way back to WPI.
This has been a capstone project for art by Nam Tran Ngoc. Thank you for reading.