First Post :D

Welcome People to my first blog post.


The GeometricShapes assignment is now TIMED.

I analyzed the beat (I had Serato analyze it for me, to be precise) and calculated the beats per millisecond.

Now a random effect will occur on every other beat. The effects are random, every time one gets a different result.

The song is called “Deja Vu” and can be found on “(R)evia” by Tua (tuamusik.de)

The Interactive animation took a lot out of me. I still have not figured out how to make it just appear when clicking without looping it.

So I figured I’d just put soundeffects on it and let it go. Not my best work, honestly.


Kaiju Video Smasher – Prop Assembly

For the flex sensor controller, a flexible foam shell in the shape of a building would pull the project together in terms of concept. Having the user smash a small building to make a film-monster smash an entire city creates a firmer connection between action and result.

The actual assembly of the foam building started with a purchase of the 1″ thick super soft foam from a site called Foam Factory. As I waited for the foam to arrive, I went out and got the rest of the supplies.

  • 1 6oz bottle of acrylic paint [black]
  • 1 6oz bottle of acrylic paint [white]
  • 2 bottles of Elmer Rubber Cement
  • 1 hot wire foam cutter [uses 2 D cell batteries]
I used rubber cement as my adhesive since I knew that it could flex without breaking and that it wouldn’t melt my foam too badly when applied.
When the foam sheet arrived, I got to work. Using a bio lab sample storage tower of a good size, I marked out a set of cutting lines and took the hot wire to the sheet.
After enough pieces of foam were cut to get a reasonable width, the layers were adhered to one another using the cement. During my first test of the cement, I found that using the normal brush applicator did not allow me to get enough of the stuff on the foam at a time, so I ended up pouring the jar of rubber cement into a plastic squeeze bottle with a tapered nozzle. This was I would just draw a think line of glue that would stay on the surface of the foam long enough for me to put the pieces together.
Eventually I got the foam slices into two solid pieces that the flex sensor would then reside in. Since the actual sensor is quite small, I taped a few inches of broken acrylic scrap onto each side so that the overall working length of the sensor was more formidible. To prevent sliding , one side of the sensor was glued to the foam while the other side was left free to extend and contract during flexing.
After inserting the sensor, the two larger foam halves were glued together and the entire assembly was let to cure overnight.
The following day, the completed tower was coated in a layer of grey paint. This was applied using a large foam brush in broad strokes.
After the grey coat had some time to dry, black windows with white banisters were added to the broad sides of the structure to give a more building-like appearance.
But I’m going to wait for the paint to fully dry before I take pictures, so stay tuned!

Kaiju Video Smasher: Software Dev 2

The last piece of the controller puzzle is now left to puredata. I need to parse the incoming serial stream from the arduino and run those values into the videoFilePlayer object that was created in the first video tutorial.

Serial Parsing

This bit took me the longest to get working. There are lots of serial reading objects out there but very few of them have documentation or sample patches, so you’re really left in the dark on how to get them to work. One that I got to convert.ascii2pd which is part of the pdmtl library. Here’s a simple example of how to use the object: [Download the patch]

Now that I can get the flex values, all I have to do is smooth them over and plug them into some video and audio player objects.

Fast forward a couple hours and I have this: [the final GUI]

Now since I didn’t have time to document the process here I’ll go into each component and how it works.

Starting from the upper with and going clockwise:

  • The standard GEMWIN and PD DSP controls, you’ll see these on any patch that uses GEM or audio computation. They open the GEM window and start the visual process and start/stop the computation of audio, respectively.
  • Serial controls. Just like I described above, this section parses the serial stream from the arduino and smooths it a bit and rounds in to an int value and sends it off to any area that receiving data from the flexvalue label.
  • Name and description. I’m using canvas objects to make the colored background by the way.
  • Flex value to frame num conversion. This area just divides the total number of frames by the maximum possible flex value [1024] so we can get a mapping of flex to frames.
  • Audio controls. This section allows the user to load an audio file and have it be scrubbed/played by the current [scaled] flex value that’s being sent around. The played audio is then sent to the speakers.
  • Video controls. Lastly, this section has a video file open dialog which feeds into a generic videoFilePlayer object from the wiki tutorials. The plyback of the opened video is controlled by a looper that takes a start and end position and continuously loops those frames. The flexvalue is used to change the start position of the loop and the rest of the info [loop length, playback speed] is supplied by the user.
Here’s a short performance video of the system in action:
http://vimeo.com/33819194


Voice Draw – Software Dev

After looking at methods of extracting a base frequency from a live audio input, I found two possible solutions. One is a processing library called Ess and the other is a pure-data object called fiddle~. After playing around with the two of them, I decided to use fiddle since it easily spits out the data I need without having to build a cludge of additional methods that Ess would require to extract what I want.

This decision makes things interesting since although audio decomposition is easy in puredata, visuals [especially drawing] are exceptionally difficult so I would opt for using processing. Since I think that things would be easier to develop if I split the functionality between two separate programming frameworks, I’m going to need some method of passing data between them. SInce that’s the case, I’m going to use Open Sound Control [OSC].

OSC used UDP to pass formatted messages asynchronously from one system to another. The advantage to using this system over say serial comms or straight TCP sockets is that both processing and PD have solid OSC implementations and tutorials to ease newbies into the process.

Using OSC, the final project will look something like the diagram above with the two programs running completely separate from each other aside from the PureData audio info being passed to processing.

Audio Extraction

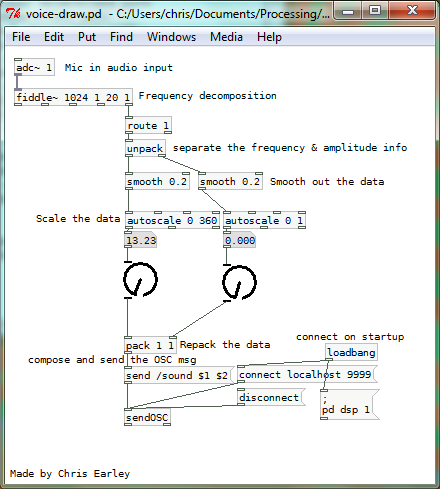
Taking everything I had decided and researched, I jumped in to throwing together a PD patch and after a few false starts and some reading of object help patches, I came up with this:

The patch takes in live input from any setup mic port and runs it through fiddle~. Fiddle~ then outputs a two value packet that contains the loudest frequency and its amplitude. From there I filter and map the values so that my job will be easier in processing. Lastly, I re-pack them and send out an OSC message formatted on the label “/sound”. Just playing around with it looks promising, you can dependably control the value to do what you want after some experimentation.

Visual Generation

Since I now have two values that I can play with, I can start thinking about how to apply them. Since I’m an avid processing user, I decided to reuse an old class of mine that simulates a “dot” that has an angle and linear velocity. I did this since the class structure already had all the update,draw, and setup methods defined from an older project.

Now all I have to do is map the values streaming in from PD to dot attributes and fidget around till get something I like.  Using the OSC parsing example on the OSCP5 library site, I took their structure and created this function:

  if (theOscMessage.checkAddrPattern("/sound")==true) {
    if (theOscMessage.checkTypetag("ff")) { // float float format
      /* parse theOscMessage and extract the values */
      float freq = theOscMessage.get(0).floatValue();
      float amp = theOscMessage.get(1).floatValue();
      println("sound: " + freq + ", " + amp);
      voiceDot.updateDotVelocities(freq, amp);
      return;
    }
  }

Every time a new OSC message is received by the program, a method named oscEvent() is called and the above code is executed. As you can see, all it does is check for the correct address and type format and if everything is go, rip out the juicy data and use it to update the dot object. In the updateDotVelodities() method the private angle and linear velocity fields are set using scaled versions of the frequency and amplitude.

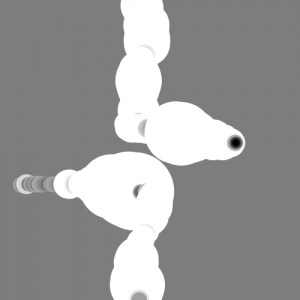
So here’s what the system generates right now:

It looks pretty boring so lets go change how the dot object is drawn and make things a bit more interesting.

For any processing primitive [in this case an ellipse] there are a few things you can control: fill color, size, stroke color, opacity, etc. This time around, I’m going to focus on color and size. Since what I am looking for is a bit more variety in color and the size of the dot itself.

After playing around for a bit I have settled on this for the dot draw method:

  void drawDot() {
    fill(this.linearVel*100);
    ellipse(this.x, this.y, this.linearVel*10+10, this.linearVel*10+10);
  }

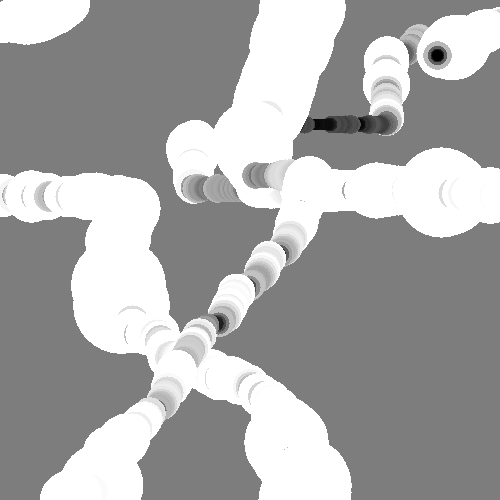
All that’s happening is that the linear velocity [which is really the amplitude value scaled] is now in control of the fill color and as the amplitude spikes, the size of the dot will expand. The best way to understand what this means is to see a sample output image:

Much cooler. And with that I am done!

Here’s a quick demo of the application: [be sure to mind your speakers for this one]

And for those interested in my work, here’s the source: voice_painter [Be sure to read the README before using]

Sample Project 2: Voice Draw


This next project was inspired by a fellow I met in the Atlanta airport. He was running an application that took webcam visuals and turned them into rather manic classical music. After about 5 minutes of watching his screen and hearing the faint tones emanate from his macbook, I asked him what he was doing. From then sparked an hour-long conversation about sonification or in general the conversion of one type of stimulus into another. From that conversation I came up with the idea of allowing the user to draw on a computer, but instead of using a normal boring interface like a mouse or a tablet, I would let them use their voice and all the noises they could muster.

Shown above is a block diagram of the system. It’ll take in live audio information and parse it to get the current loudest frequency and its amplitude. Then those two data points will be scaled and mapped to a set of variables that will control the “brush” that the user will draw with. Lastly, the mapped values will be used to draw the simulated brush and the artwork will be shown live to the user to close the feedback loop.

To pull this off, I’m going to need to figure out:

  • how to parse live audio from a microphone
  • how to map the live sound data and clean it up [noise is always an issue]
  • how to draw the “brush”


Kaiju Video Smasher – Software Dev 1

With the general idea for the patch decided and the sub components outlines, it’s time to start patching.

Starting the project. I have all the hardware I think I’ll need with me.

  • A flex sensor
  • My arduino with protoboard and prototype shield
  • Access to an old ECE kit full of resistors and such
After doing some quick google searching for flex sensor and found this handy site: http://itp.nyu.edu/physcomp/sensors/Reports/Flex
It has a ton of good info about the use of a flex sensor and some interesting amplifier schematics for filtering the output of the sensor. Since I don’t have access to an opamp, I’ll keep looking for an easier circuit to interface with my arduino.

From the product page at sparkfun [http://www.sparkfun.com/products/8606] I got a hold of the sensor’s data sheet and with that applied the flat and flexed resistance values to some voltage divider equations I found on this site [http://protolab.pbworks.com/w/page/19403657/TutorialSensorsscroll down a bit] to calculate the voltages that arduino will measure when the sensor is flat and when it is flexed. I just guessed the 1k ohm resistor value, but after chugging through the voltage divider equation, I’ll get around 2.1 volts difference between flat and flexed. That should suffice.

I cobbled together the circuit defined at the site above so I can start working with the arduino. Here’s my fritzing layout:

Taking the  voltage divider setup and the AnalogInSerialOut sample sketch in the arduino software I have been able to see how the voltage signal from the flex sensor changes as it’s manipulated. Over the entire range of safe flexibility, the digital values reported from the arduino had a value range from 150 to 600. Since I want a range from 0 to 1024, I’ll remap the values using map() and then send them out as a formatted serial string.

For outputting, my method is super-simple just take the value and print it using Serial.print() in a set format. My printing code is as follows:

  Serial.print(' '); // lead with a space
  Serial.print('F'); // print out value label
  Serial.print(' '); //another space
  Serial.print(outputValue); // the int flex value
  Serial.print(' '); // wow, another space
  Serial.print('r'); // "newline"

The code above ends up printing out things like ” F 730 ” which can be easily parsed in pure data which is what I’m going to work on next.

Sample Project 1: Kaiju Video Smasher

Kaiju is a Japanese word that means “strange beast,” but often translated in English as “monster”. ~ Wikipedia – Kaiju

This project aims to give users the ability to control the playback of public-domain segments of Japanese monster films using a foam model of a high-rise building. In the end the final installation should provide a glitchy/noisy media accompaniment to the violent interaction with the physical controller. Since the system revolves around playing media with flexible controls, puredata is a natural choice for a development environment since that is its specialty.

As a general first step, it helps to make a visual flowchart of the system to get an idea of what elements will be involved in bringing the project to life. Below is a simple chart of how the user input will pass through the system to become cut-up monster footage.

(Click to Expand)

Looking at the chart, one can already see a few needed features that need to be explored and implemented:

  • Understanding how to hook up a flex sensor and understand its input with an arduino.
  • How to take that sensor input and output a formatted serial stream to the computer using puredata.
  • How to map the sensor values from the arduino to a video/audio controller.
  • How to play and control video in puredata.
  • How to play and control audio in puredata.
  • How to play video in full screen.

Over the next few blog posts, each of these issues will be researched and finally implemented.