The video below represents my finished product for the Data Art Sketch with some animation to it. The sketch is supposed to represent the educational inequality between Black, Hispanic, and White people. This is represented with the books on the scale, with the brown and orange books representing Black and Hispanic opportunities, while the right side represents White opportunities. The visual is supposed to communicate that the combined data of Hispanic and Black opportunities in the U.S. is lower than the amount that White people are offered. This is upsetting because of how innocent people that want to learn are being restricted due to their skin color.
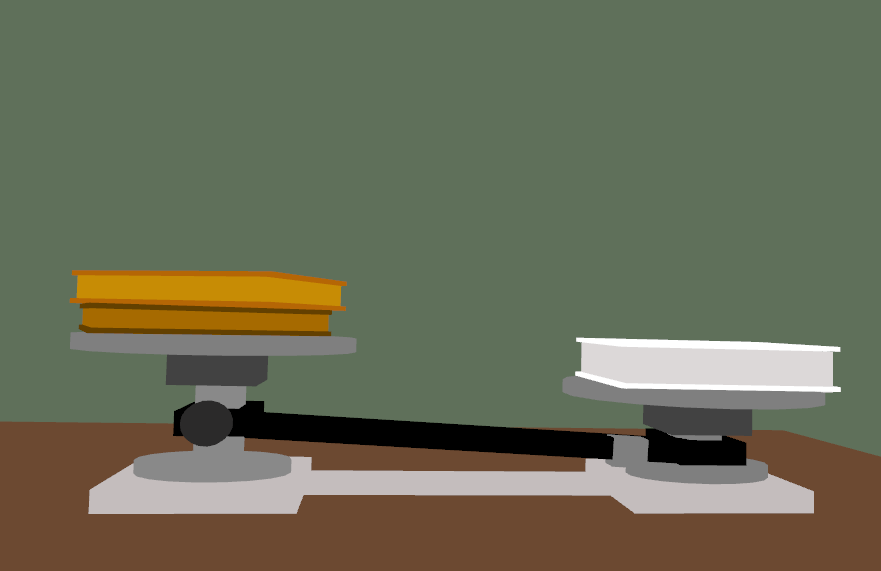
The difference between the sketch is that there are two pieces of interactive animation. The first piece is the gram bar that is located next to the white book and scale. When you click the bar, the gram goes slowly up the incline, and then quickly back down it. This element of animation is to showcase the steepness of the situation and how unbalanced the scale is. It allows the audience to feel a sense of weight from the animation.
The second animation is that of clicking on the orange book. When the book is clicked, the book lifts off of the scale for a few moments. When this happens, the scale and the black book also rises up a little bit. This is done to showcase how when the black book is on its own, the statistic grows even larger than what it was before. This is used to represent the difference between the two values combined and how it compares when only comparing one variable (i.e. the black book) to the other object on the scale (i.e. the white book).
One question that I will ask for the class (noted hear to remind myself) is how I could have represented this same data in a more simpler form? I like to hear other opinions on how they would have represented the data and I would like to broaden my ideas on how other artists would visualize the data.
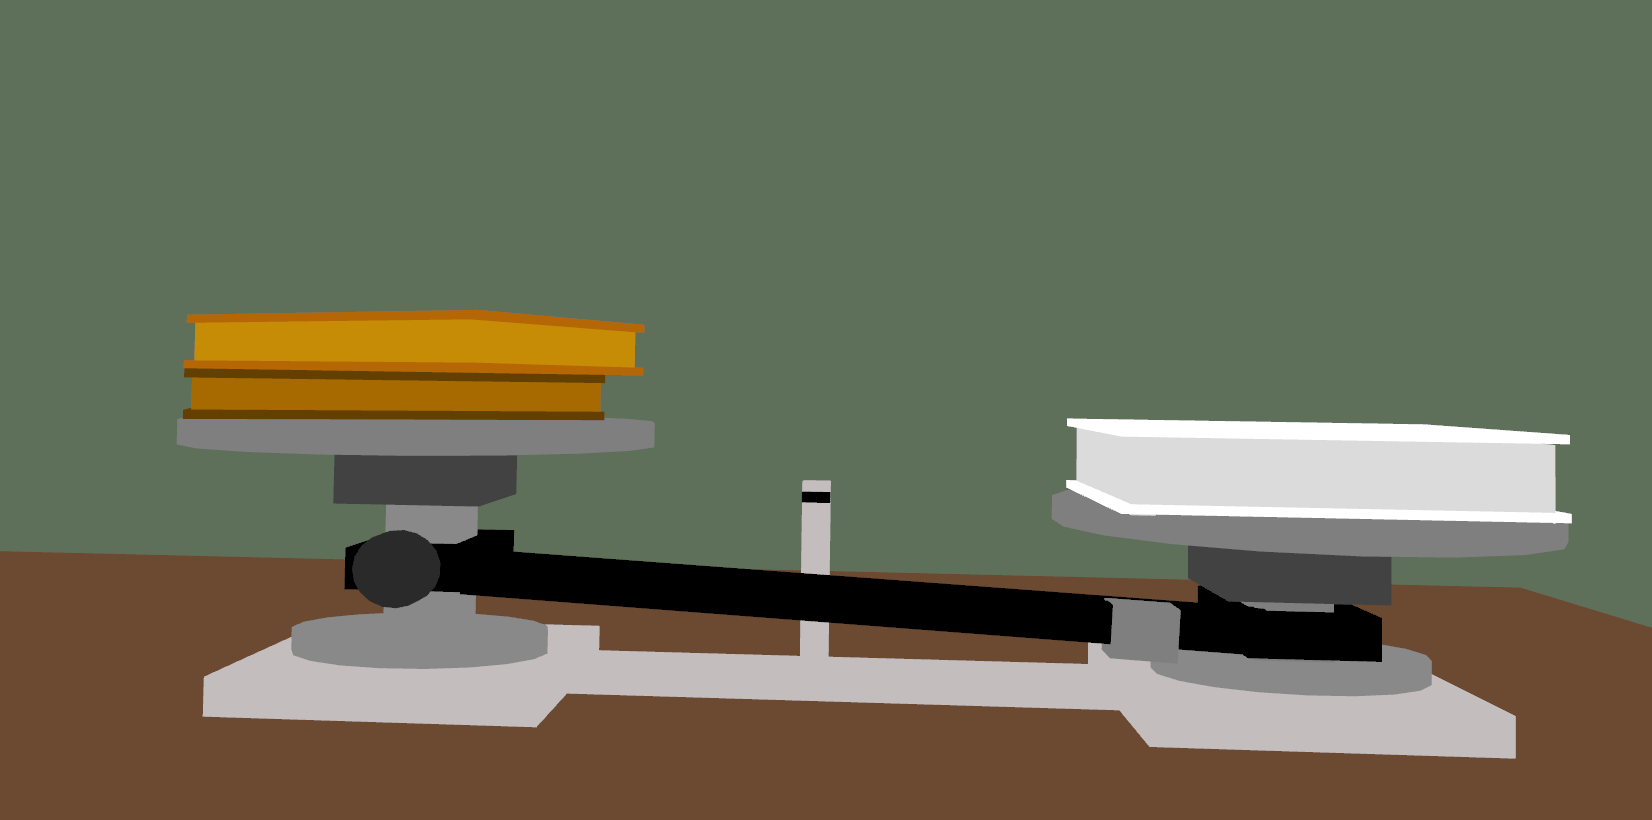
Update: I added motion to the right side with the white book and scale. This animation change will allow for more fluent motion to the whole project, rather than just on one side. By a comment recommendation, I added an object in the middle of the scale, with an indicator to showcase what height the scales are equal on. The point of the measurement is to allow the audience to see what height level the scales should be equal on. Below is the video link for the updated one.
Observation: At first I was confused as to why your description was referring to a “black book” when I see two shades of brown and one white. It took a minute before it occurred to me that this could be a racial statement.
That is the message of the piece, but I do see how my description is somewhat vague. I probably should revise the description and allow the reader to fully understand what the piece is actually referring too.
The amount of effort you went into animation each of those individual shapes for the books and scale rising is very impressive, and your animation highlighting the education discrepancy and it’s severity provokes a lot of thought.
I agree with the comment about the animation. However, I am thinking about also making the other side of the scale (with the white book) sink down.
I have an opinion on the framing of the piece. I feel as if the framing looks really good, and I could believe that I am looking at the top of a desk to see this sitting on it. The background being a plane of color also helps and keeps the piece from being visually distracting.
I was trying to aim for that in the visual. I am glad that it is visually clear for the audience to see.
I have an opinion about the design of the scale. Most scales have markings for the units of measurement or a bar to show the center of balance. I think having a clear marker for the center would better emphasize that it is not equal.
That is a cool idea that I haven’t thought of for the project. I’ll try to incorporate it, without it hindering the motion of the gram bar.
Before reading the description and background behind the piece, I was very confused that one of the books was floating.
I can see how you would be confused. However, I don’t really know another way to represent the book rising up, without it being overly complicated.
Answering your question, your data is very easy to follow and impactful which is why I would not change it because it already encapsulates everything nicely.
Good to know. I was worried that I may have overly complicated the overall-visual and the audience would not get the message.
I noticed how detailed the piece was. It’s really interesting!
Thank you.