Climate change has always been the elephant in the room in our everyday lives. We hear about global warming and carbon-dioxide emission everyday, but a lot of the time we perceive them as somewhat abstract ideas.
This data sketch is a visualization of the carbon footprint of our favourite foods. We enjoy eating them everyday, but we might be not aware of the environmental impact of consuming them.
This is our earth.

And here are some more spheres – representing the carbon dioxide emission produced by foods:
Nut (brown), corn (yellow), and milk (white).
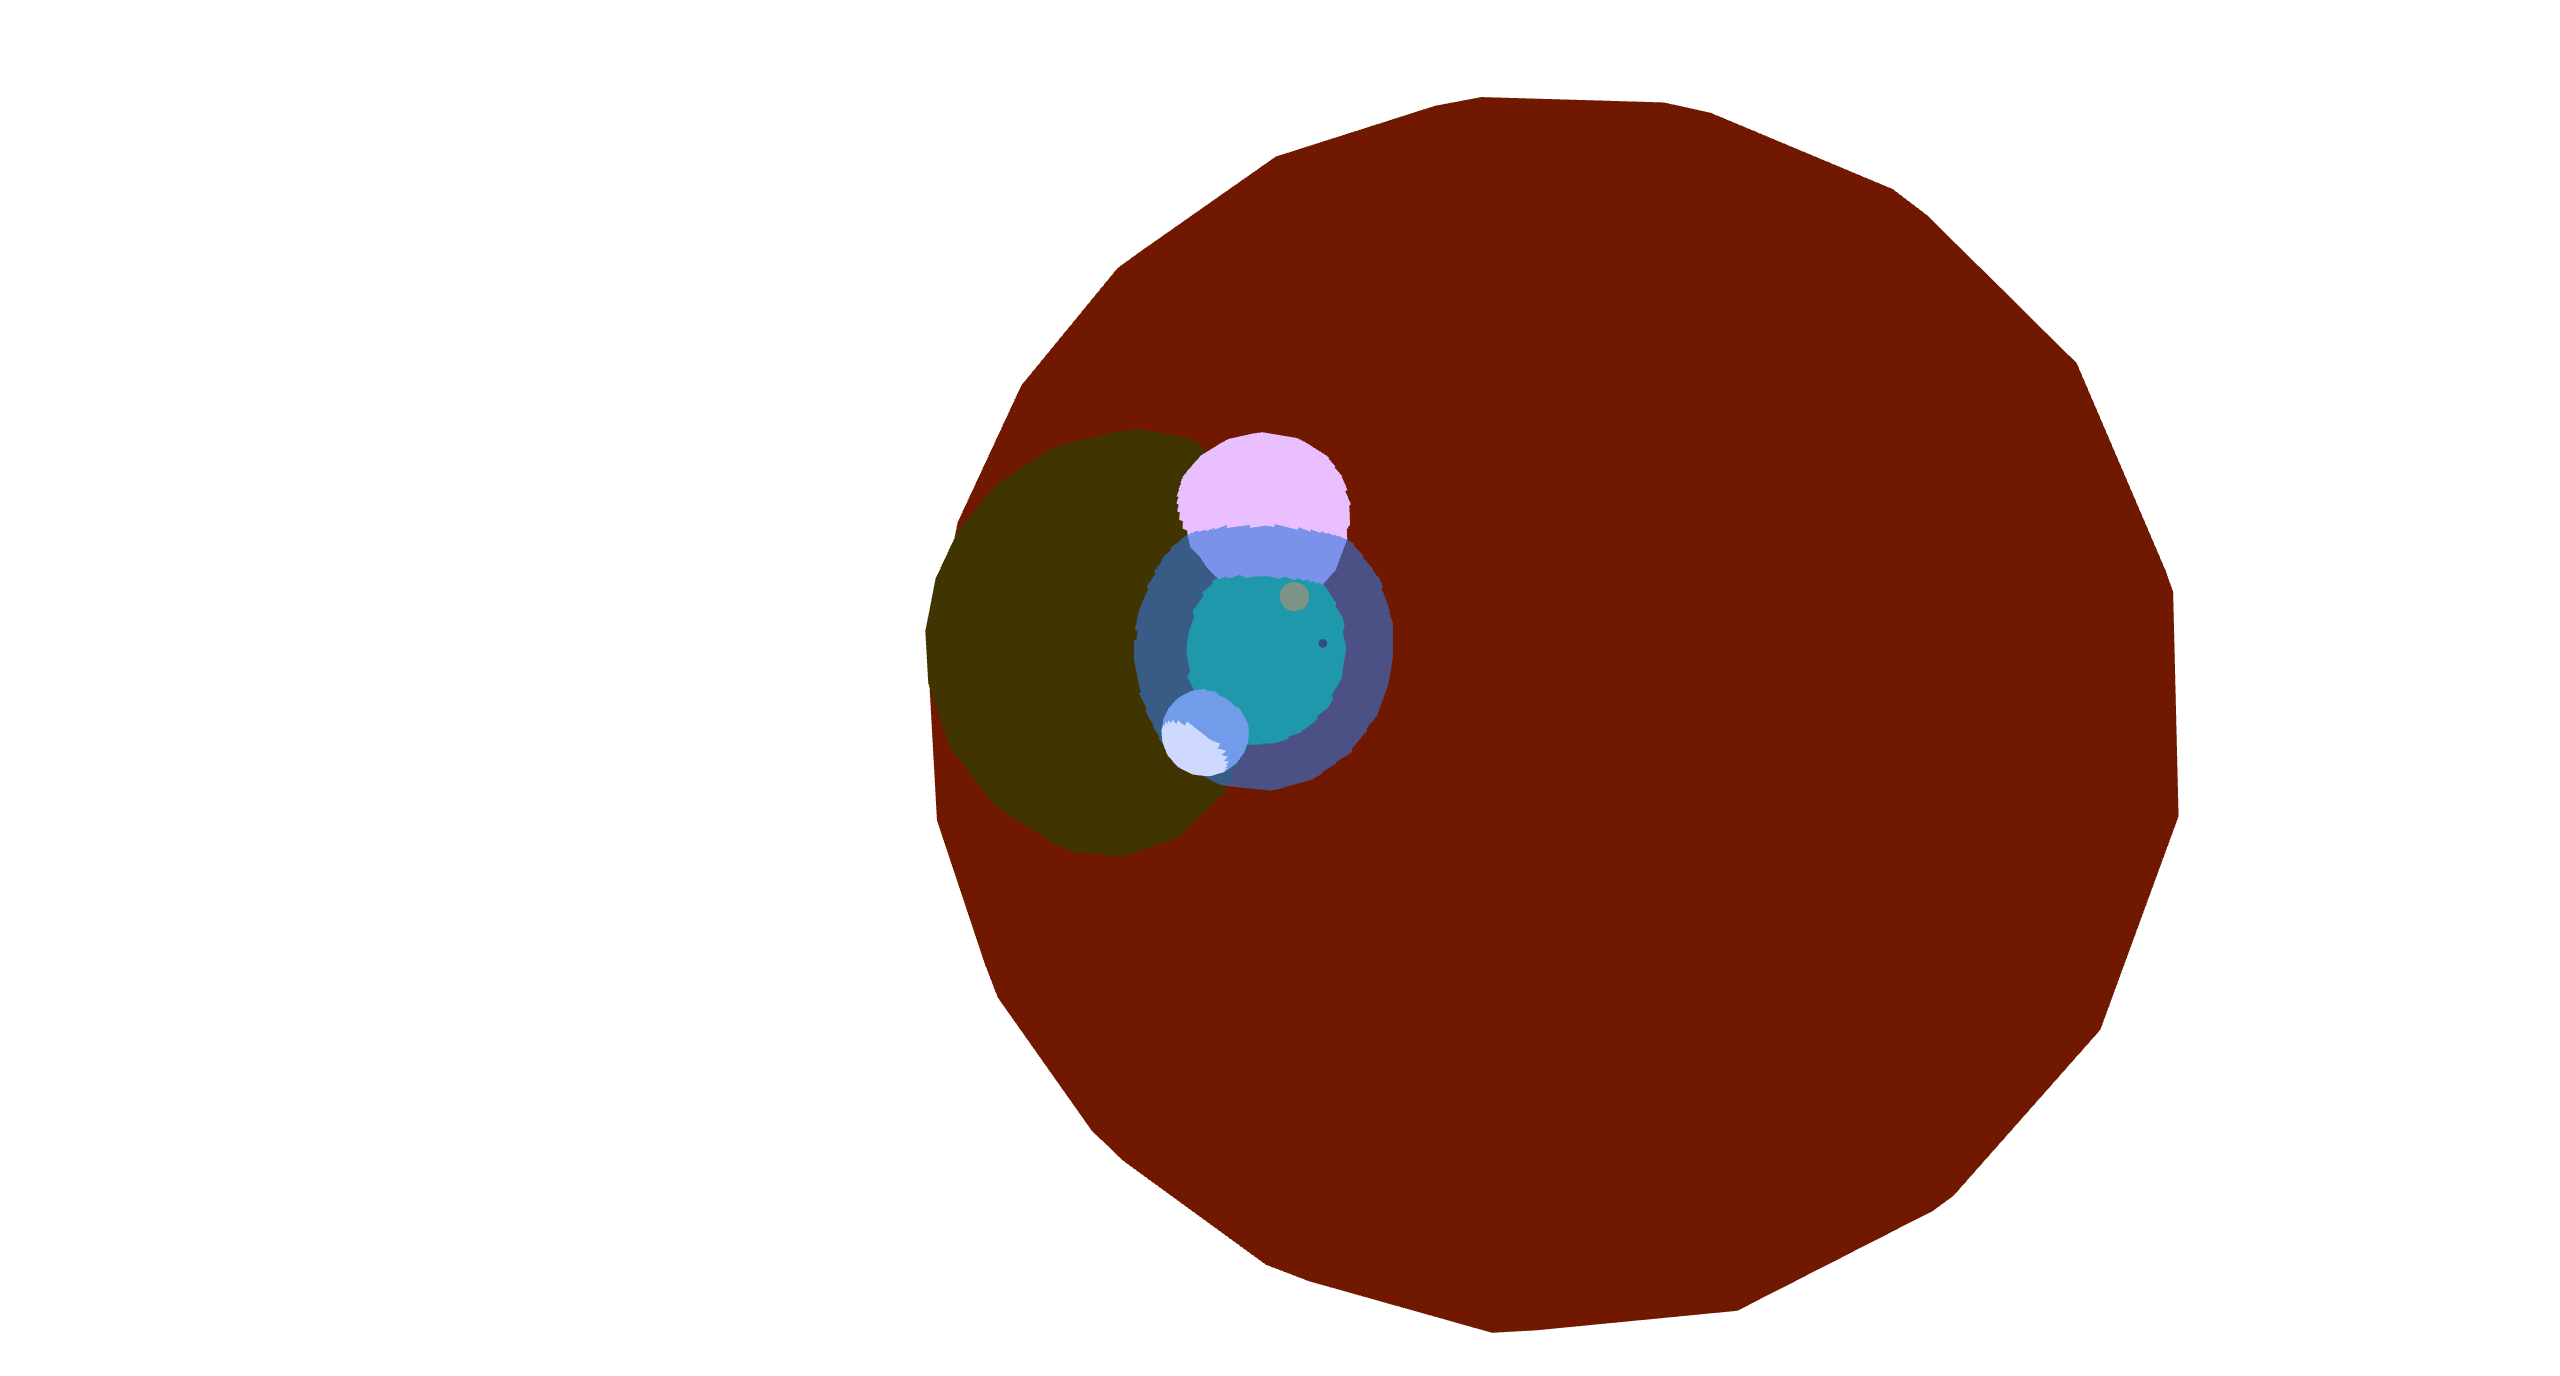
The size of the sphere is proportional to the carbon emission produced by each type of food per unit mass.

Here comes coffee (coffee) and pork (pink).
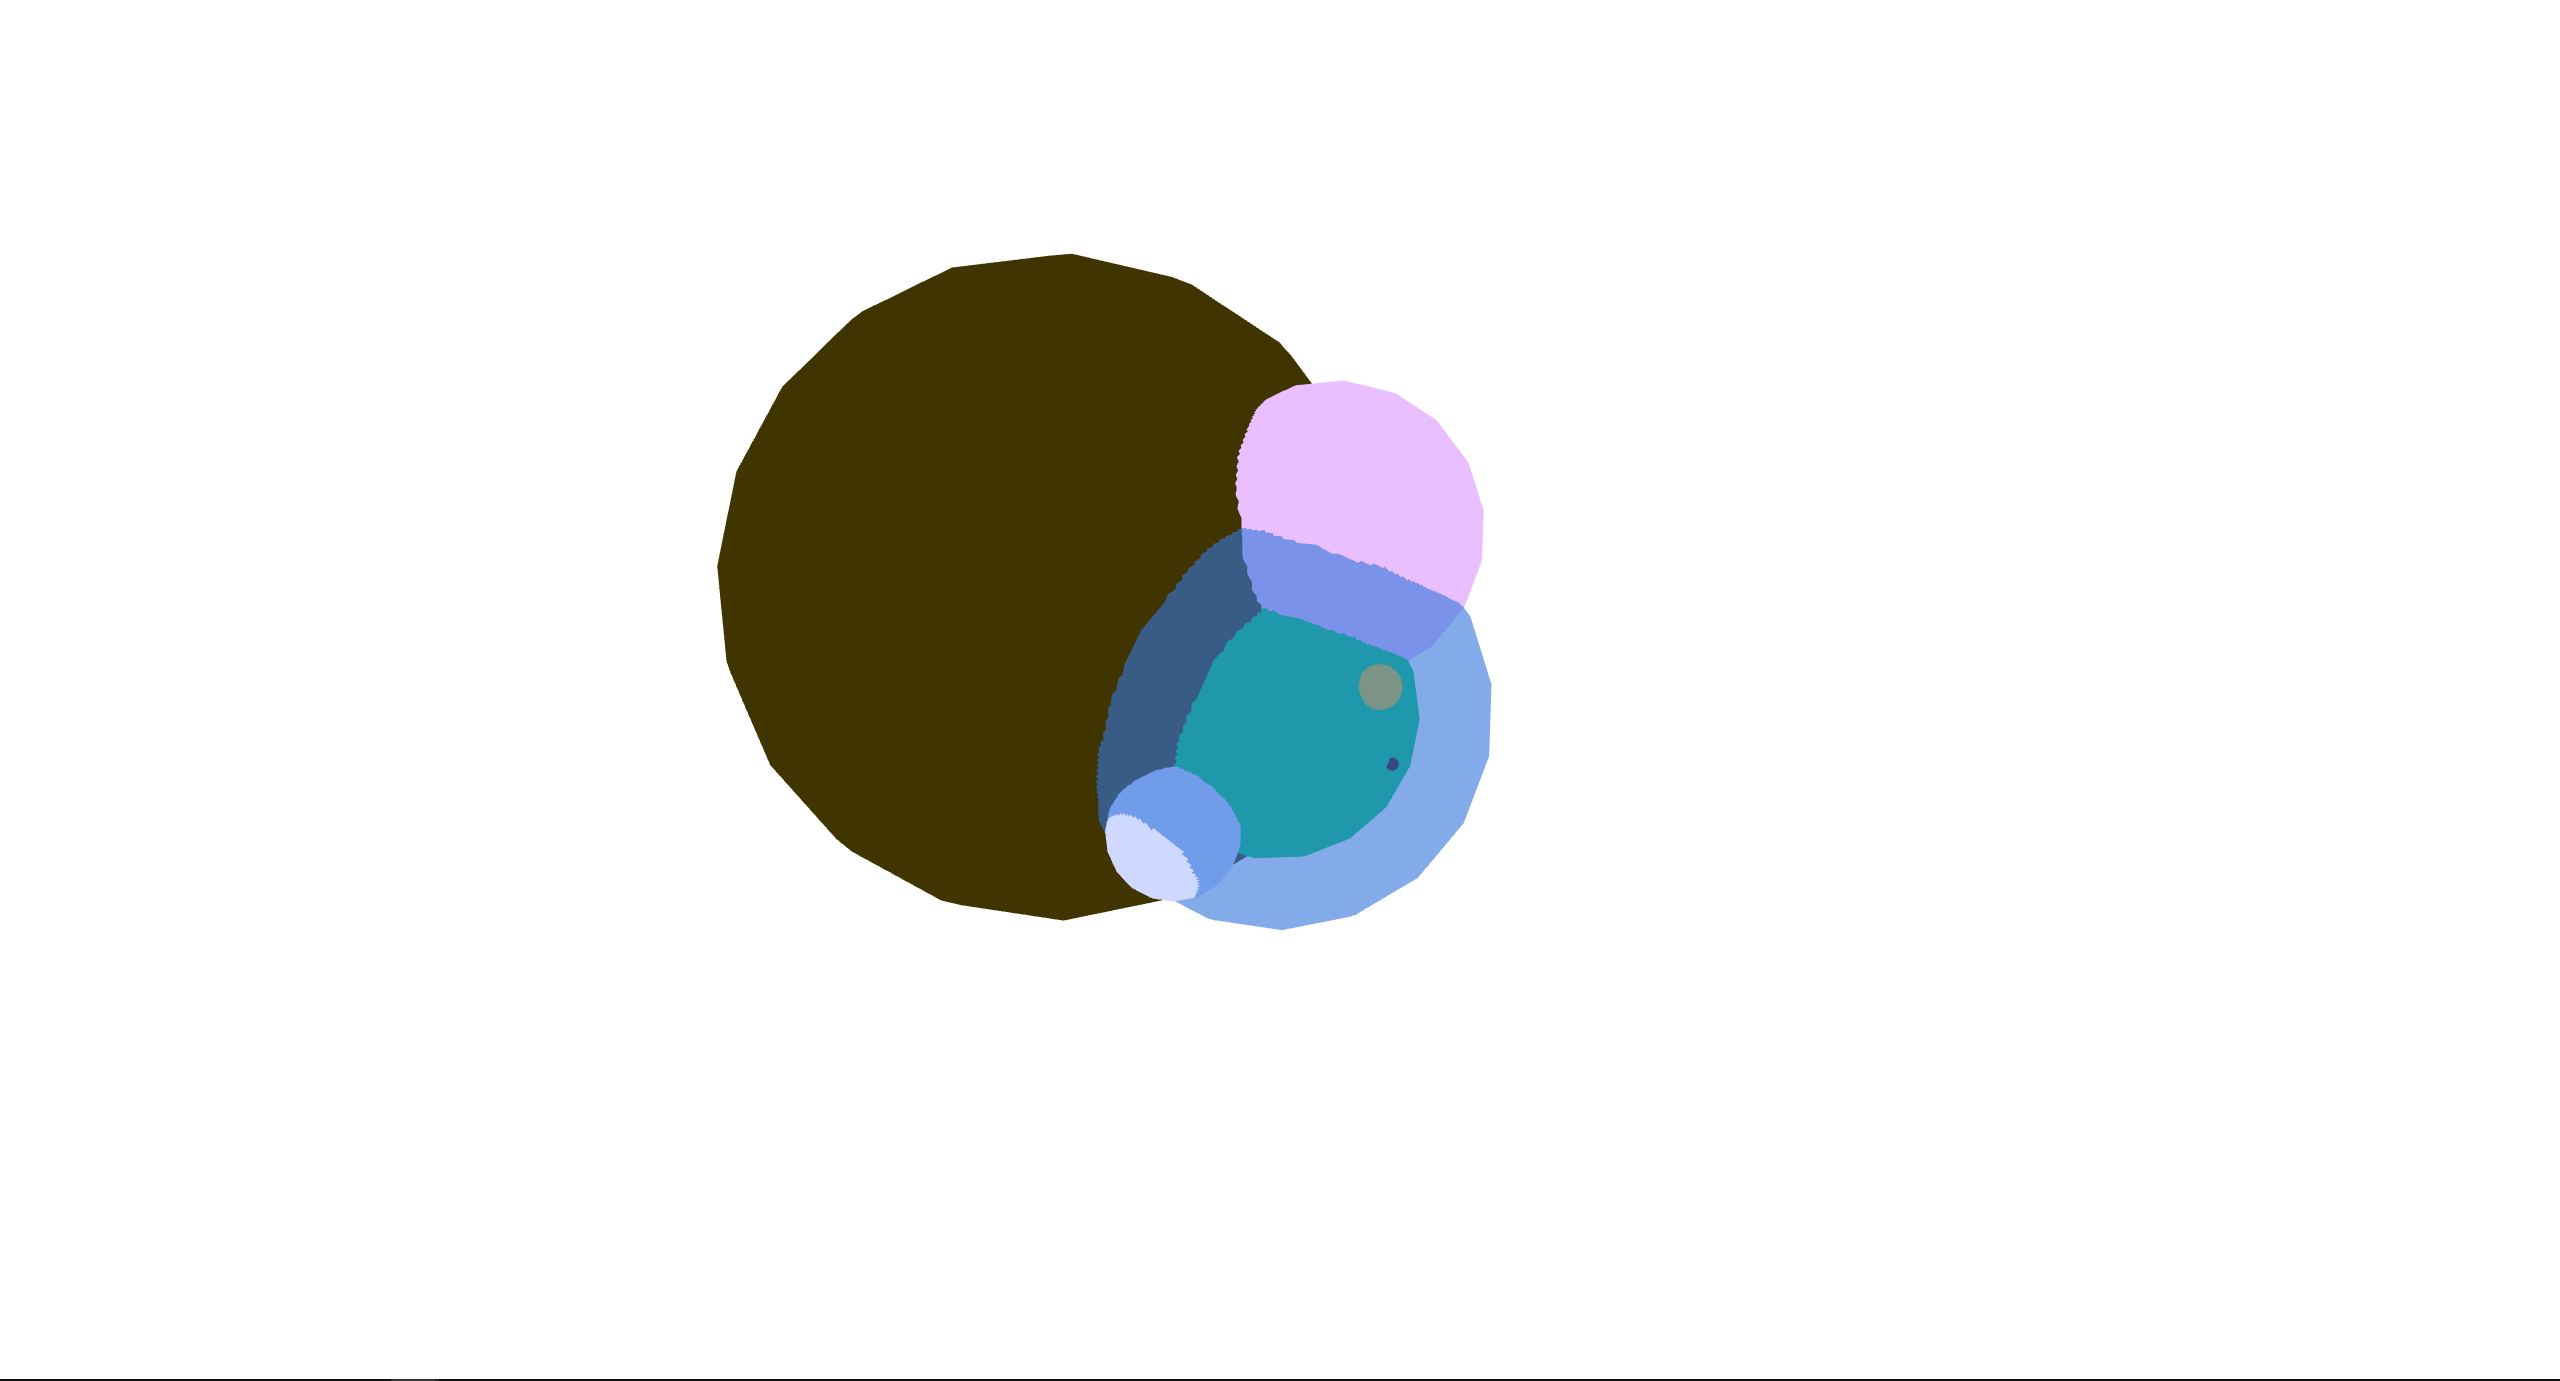
And finally, it is beef (red).

The question is: how can I make my work more self-explainatory? I want viewers to understand without reading a lot of words.
Source:
You want to reduce the carbon footprint of your food? Focus on what you eat, not whether your food is local
by Hannah Ritchie January 24, 2020 https://ourworldindata.org/food-choice-vs-eating-local
How do the carbon footprint of foods compare? – Our article as a video
by Hannah Ritchie May 14, 2020 https://ourworldindata.org/vox-carbon-footprint
Wow – this is a powerful image. I could see the spheres starting from nothing and then slowly growing one by one, ending with beef and its massive scale to hit the point home.
This is an incredibly powerful image- I think you should make it so the viewer has to click to reveal each one, and maybe add a label to what each one is. I definitely think you captured a feeling of anger and disgust with this piece.
Very well done. I think if the spheres bore the form of food item itself (i.e. coffee’s emissions represented with a coffee bean) it would most clearly visualize what the footprints are.
Love this piece and how it represents a molecule. I think just adding labels will demonstrate all the different components, I feel that showing the spheres as actual food items themselves kind of distracts from the piece.
I really like how you made this! Someone mentioned this, but I think one way to make it more self-explanatory is to add images onto the spheres like simple icons for the different food types. I also think it was cool how you represented the earth with the semi-transparent sphere around the solid one and am curious what it would look like if all the spheres representing the carbon emissions were represented like that (although I’m not sure if that would be too busy visually).
I think that your sketch is already very effective, but maybe the earth part could look more grounded by adding green or using less pale colors.